Infrastructure needs to be monitored and there exist several tools for this task, not at least because the term “monitoring” is rather fuzzy.
However, two great tools for this task are graphite and Prometheus.
Both have their pros and cons, like with graphite it is much simpler to keep data for long term analysis, while Prometheus shines with it’s powerful query language, named prom-ql.
But there are way more and I won’t discuss them here, it’s pretty much dependent on ones needs and general preferences which one to use.
So…
What is Prometheus?
In short:
Prometheus is a set of tools for monitoring, some of which are optional.
In it’s core, the Prometheus Server takes care of collecting and storing metrics in a highly performant time series database and makes them available for further processing (like querying them or sending alerts).
The Metrics are mostly scraped from so called exporters.
They are one of prometheus strengths, because the ones it brings are already powerful and there already exist a ton of exporters from the community for all kinds of services, also it’s kind of simple to implement custom exporters.
Optional components are the Alertmanager, the Pushgateway and third party dashboards like Grafana.
What’s this article about?
I’m going to set up a Prometheus server, an alertmanager, a grafana server with an example dashboard and scrape some metrics to fiddle with promql and display them in a grafana dashboard.
What’s needed?
- 3 VMs with Debian Buster (bullseye should work too)
Let’s go… basic setup
I’ll name the three VMs “prometheus”, “grafana” and “alertmanager”,
make sure that prometheus is able to reach them all and grafana is able to connect to prometheus.
On prometheus install the prometheus package:
root@prometheus:~# apt-get install prometheus On alertmanager install the prometheus-alertmanager package:
root@alertmanager:~# apt-get install prometheus-alertmanagerOn grafana install the grafana package.
With grafana it really is best to use the package they provide.
apt-get install -y apt-transport-https software-properties-common wget gnupg

echo "deb https://packages.grafana.com/oss/deb stable main" >> /etc/apt/sources.list.d/grafana.list

wget -q -O - https://packages.grafana.com/gpg.key | apt-key add -

apt-get update
apt-get install grafana
On all hosts install the prometheus-node-exporter:
apt-get install prometheus-node-exporterIf everything worked, then you should have a basic install by now and should be able to see the webinterfaces of the services.
- prometheus.your.domain:9090
- alertmanager.your.domain:9093
- grafana.nik.local:3000

The initial credentials are admin:admin.
Check if the exporters are working in general.
Therefore on any or all of the hosts do:
curl localhost:9100/metrics
curl oneofthehosts.your.domain:9100/metrics
You should see lots of metrics like this, more on that later.
# TYPE apt_upgrades_pending gauge
apt_upgrades_pending{arch="",origin=""} 0
# HELP go_gc_duration_seconds A summary of the GC invocation durations.
# TYPE go_gc_duration_seconds summary
go_gc_duration_seconds{quantile="0"} 9.929e-06
go_gc_duration_seconds{quantile="0.25"} 1.63e-05
go_gc_duration_seconds{quantile="0.5"} 2.249e-05
go_gc_duration_seconds{quantile="0.75"} 4.0521e-05
go_gc_duration_seconds{quantile="1"} 0.00410069

root@prometheus:~# curl -s localhost:9100/metrics | grep node_disk_written_bytes_total
# HELP node_disk_written_bytes_total The total number of bytes written successfully.
# TYPE node_disk_written_bytes_total counter
node_disk_written_bytes_total{device="sr0"} 0
node_disk_written_bytes_total{device="vda"} 8.2030592e+07
Basic installation is finished and working.
Let’s check the…
prometheus configuration
A quick overview:
Prometheus server may be started with lots of arguments.
There are four categories of them:
- config
- the config file, defaults to: /etc/prometheus/prometheus.yaml.
- storage
- parameters on where to store tsdb data and how to handle it
- web
- web paramaters, like the url under which prometheus is reachable, api endpoints, etc.
- query
- query parameters, like timeouts but also max-samples, etc.
On a debian system, these parameters are defined in /etc/default/prometheus and for this setup they are sufficient.
The prometheus.yaml can be split in the following sections:
- global
- global parameters for all other sections like scrape and evaluation intervalls, etc., may be overwritten in the specific configurations.
- scrape_configs
- the actual job definitions on what to scrape, where and how
- alerting
- parameters for the alert-manager
- rule_files
- files that contain the recording and alerting rules
- remote_read + remote_write
- parameters for working with long term storage like thanos and/or federation
Rule files are periodically evaluated for changes and the prometheus-server itself may be SIGHUPed to gracefully reload it’s config (/etc/prometheus.yaml).
This can also be done via an api endpoint (/reload) if enabled.
Let’s build a useful config-file to scrape our hosts.
This one, aptly named “node”, just scrapes the exporter on localhost (prometheus) and grafana.your.domain.
But, for the purpose of demonstration, I’ll override some parameters in job context, like scrape_interval, etc..
sample_limit is important here, because it prevents collecting too may samples, marking the scrape as failed. This may also prevent what is called “cardinality explosion” in Prometheus (more on this later).
The job config itself is static, which is OK if one has a defined set of metrics to check, which doesn’t change too often and get’s distributed and reloaded by some mechanism.
We’ll stick to that for now.
scrape_configs:
# The job name is added as a label `job=<job_name>` to any timeseries scraped from this config.
  - job_name: 'node'

# Override the global default and scrape targets
    scrape_interval: 15s
    scrape_timeout: 10s
    sample_limit: 1000

    # metrics_path defaults to '/metrics'
    # scheme defaults to 'http'.

    static_configs:
      - targets: ['localhost:9090']
      - targets: ['grafana:9100']
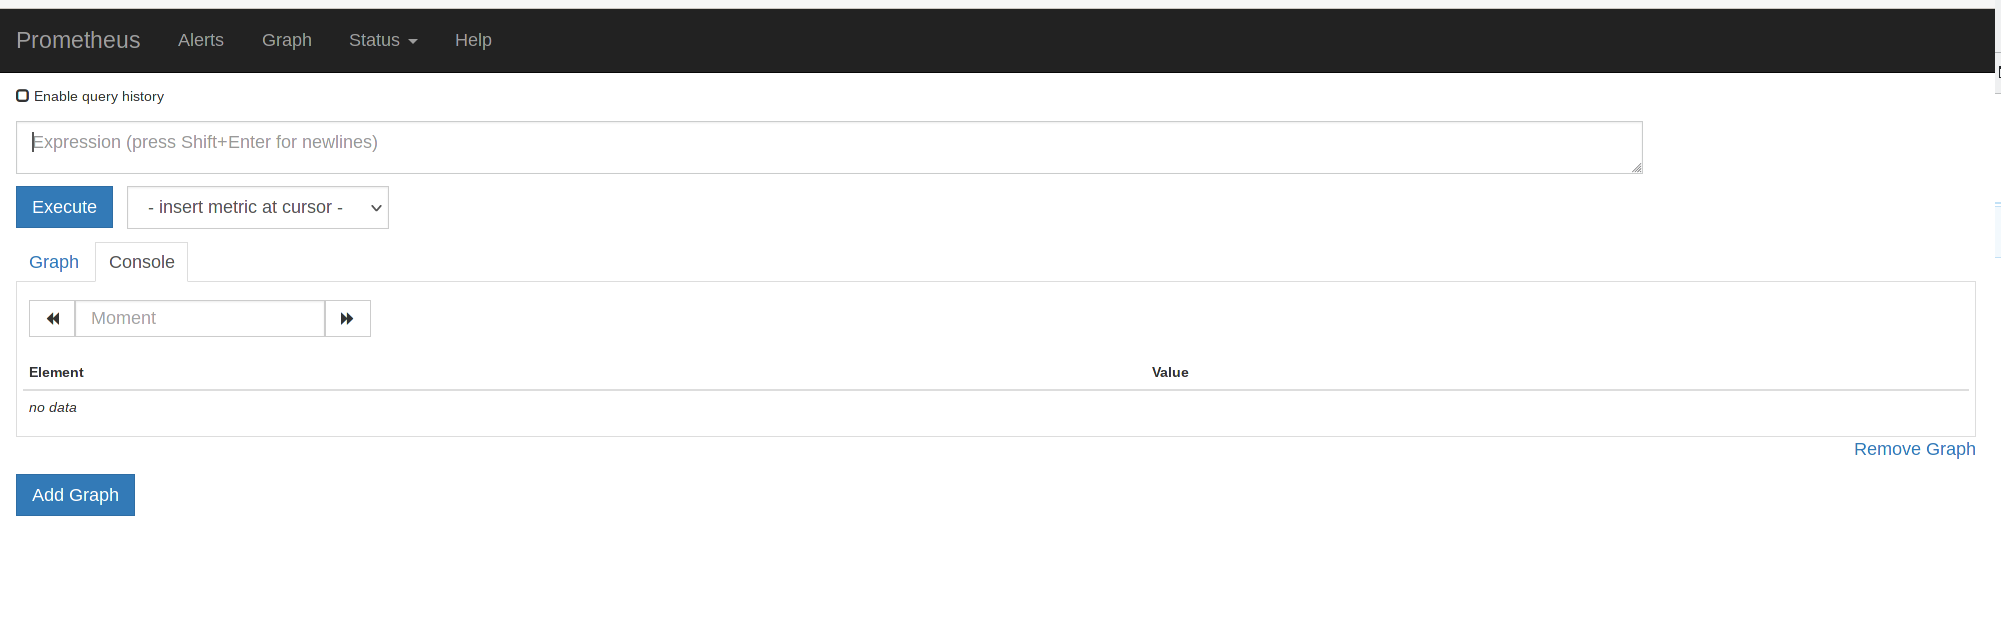
Now, that there is an initial working config, one may access the metrics via the configured url of the prometheus server:
http://prometheus.your.domain:9090/targets
One may create a graph from those metrics now, by clicking on “Graph” and starting to type. For Example:
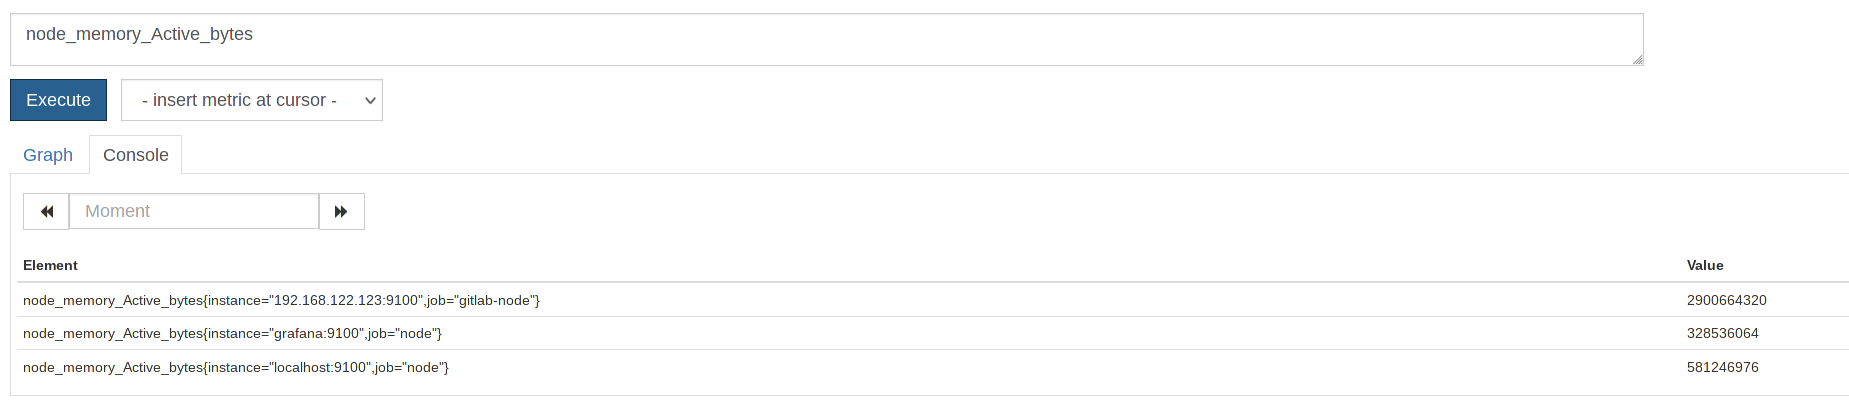
Execute it and you’ll get a list of Instances and Jobs with this metric.
Choose the one you are looking for (or all), copy it to the search bar and click on “Graph”.
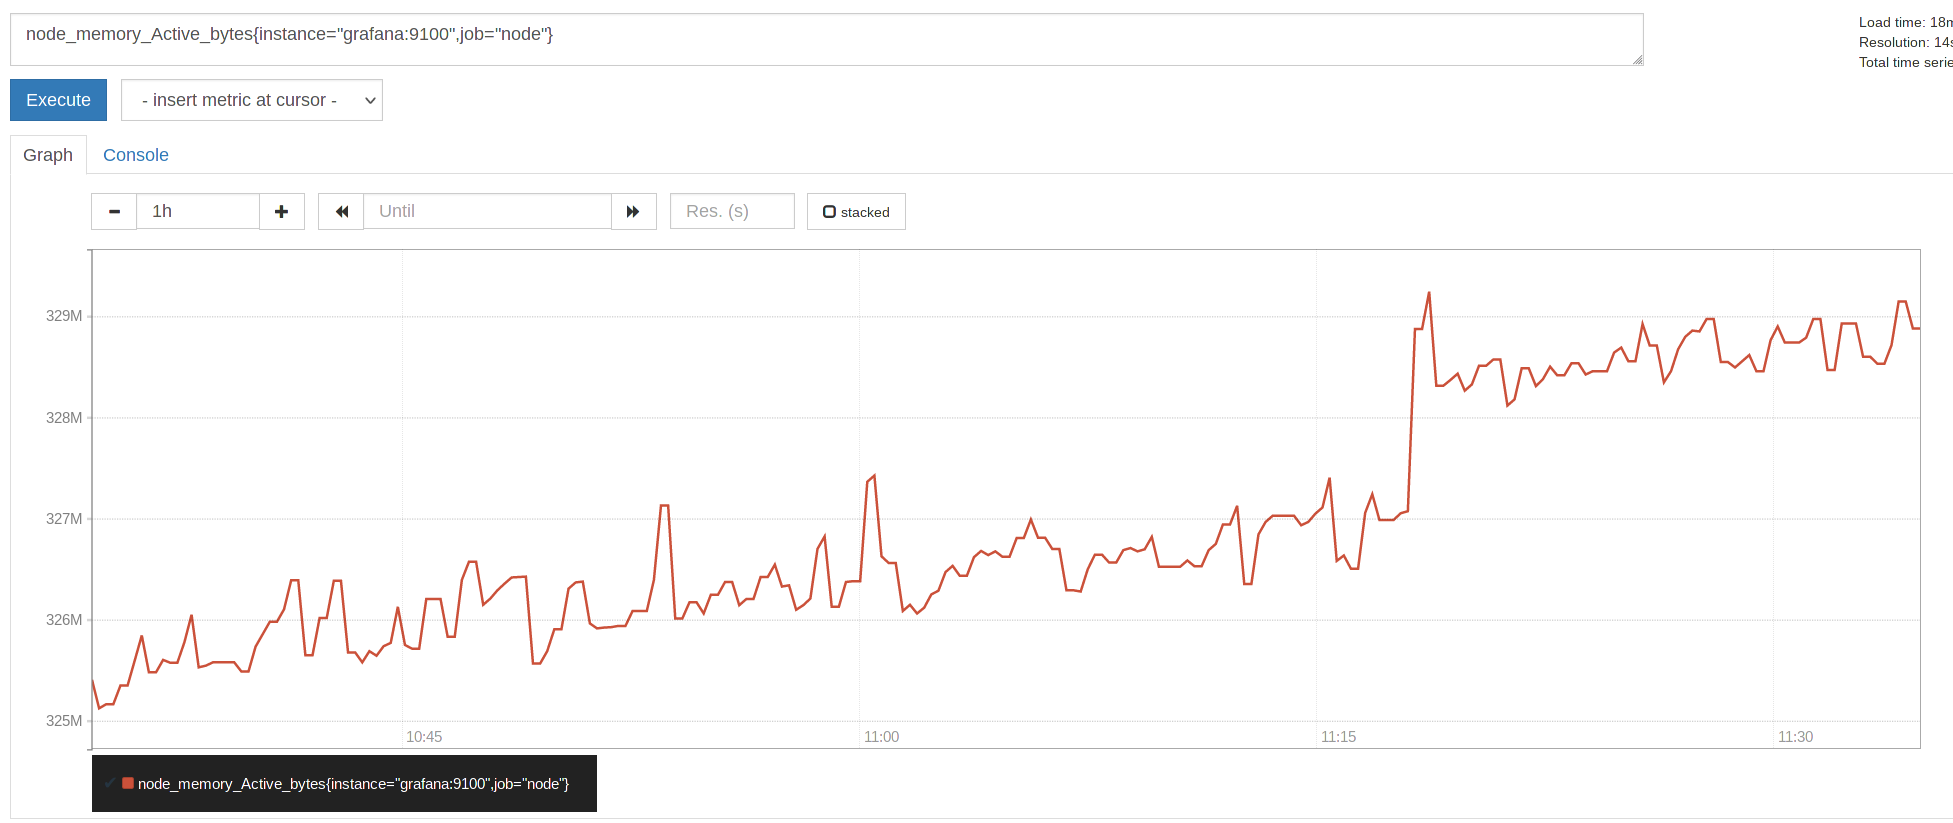
Good, now that this is working, a few words on the scrape config and especially labels.
Prometheus uses labels for almost everything and has some powerful functions to manipulate and thus work with them.
Labels are the key/value pairs associated with a certain metric.
In the example above, it’s instance=’grafana’ and job=’node’, placed in {}, they are assigned to a metric.
Of course these are basic labels and one may add lots more.
That’s were one needs to be careful, because each unique combination of labels and metrics add a new time series in the database, leading to the aforementioned “cardinality explosion” eventually.
So, choose labels wisely and never ever use dynamic, unbounded labels, like user ids and such.
Read more on this topic: here.
Alright, let’s check out how relabeling works:
Add a new label (this would also update an existing label foo with the value bar):
- job_name: node
    static_configs:
      - targets: ['grafana:9100']
      - targets: ['localhost:9100']
    relabel_configs:
      - target_label: "foo"
        replacement: "bar"
One can also rename and drop Metrics which match regexes and also chain those rules, you may want to check out this excellent site with examples.
However, don’t confuse relabel_configs with metric_relabel_configs.
metric_relabel_configs is applied after a metric was collected, but before it is written to storage, while relabel_configs is run before a scrape is performed.
You may use this to drop specific metrics until problems are fixed on a client, for example.
This one drops all the metrics for sidekiq_jobs_completion_seconds_bucket{job=”gitlab-sidekiq”} from my gitlab server.
- job_name: gitlab-sidekiq
    metric_relabel_configs:
      - source_labels: [ __name__ ]
        regex: sidekiq_jobs_completion_seconds_bucket.+
        action: drop
You could find such a problematic metric with this query, which will list the top 20 time series (check out this blog on the topic):
topk(20, count by (__name__, job)({__name__=~".+"}))Grafana
Now that we have a rudimentary understanding of the config and are scraping the exporters on two of our hosts, let’s connect Grafana, so that we can paint nice Graphs with powerful promql.
After login, find the configuration symbol on the left side and choose Data sources.
It is sufficient to enter the URL of your Prometheus server here.
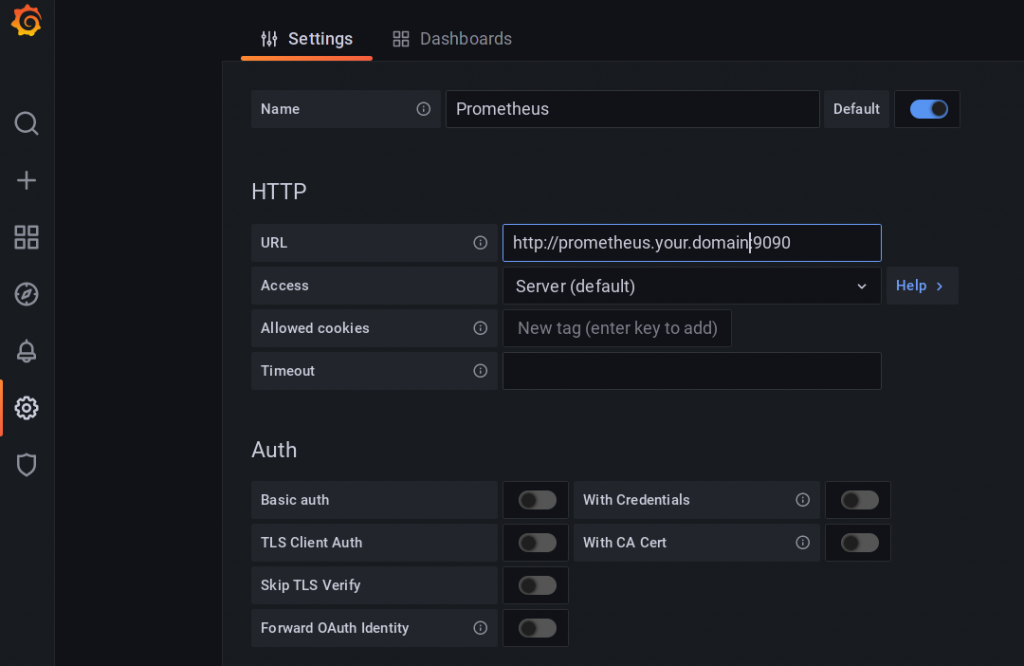
Of course, there is a ton of options and Grafana itself can be used to as a Frontend for many data sources like databases, Elasticsearch, and so on.
If you are configuring Grafana for an Organization, you might also want to check out the User- and Org Settings.
For the sake of this Tutorial, we are done with the configuration.
Let’s build some graphs.
Add a new dashboard:
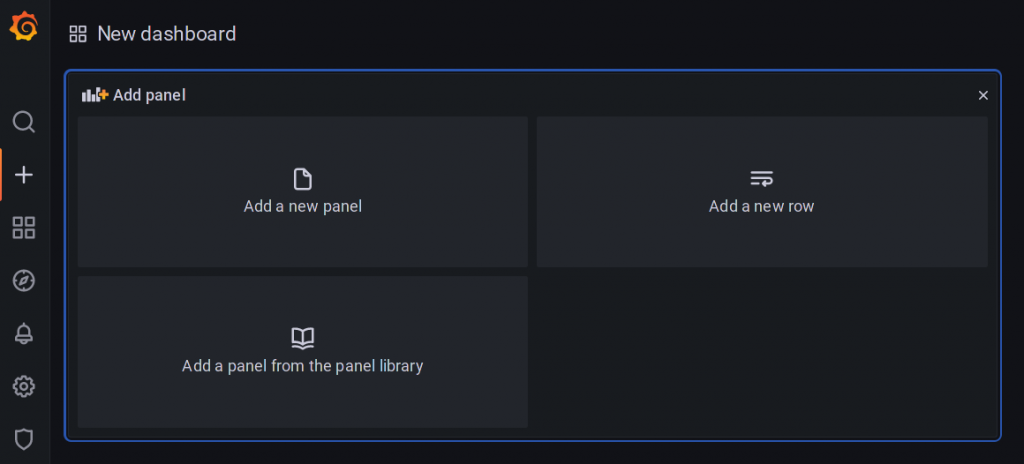
klick on “add a new Panel”
Our Data source “Prometheus” should be visible.

CPU Graphs are always good, let’s add one for system and for User CPU Time.
avg(irate(node_cpu_seconds_total{mode="system", job="node",instance="grafana:9100"}[5m]))

avg(irate(node_cpu_seconds_total{mode="user", job="node",instance="grafana:9100"}[5m]))
As you type, Grafana will provide you with options for auto completion.
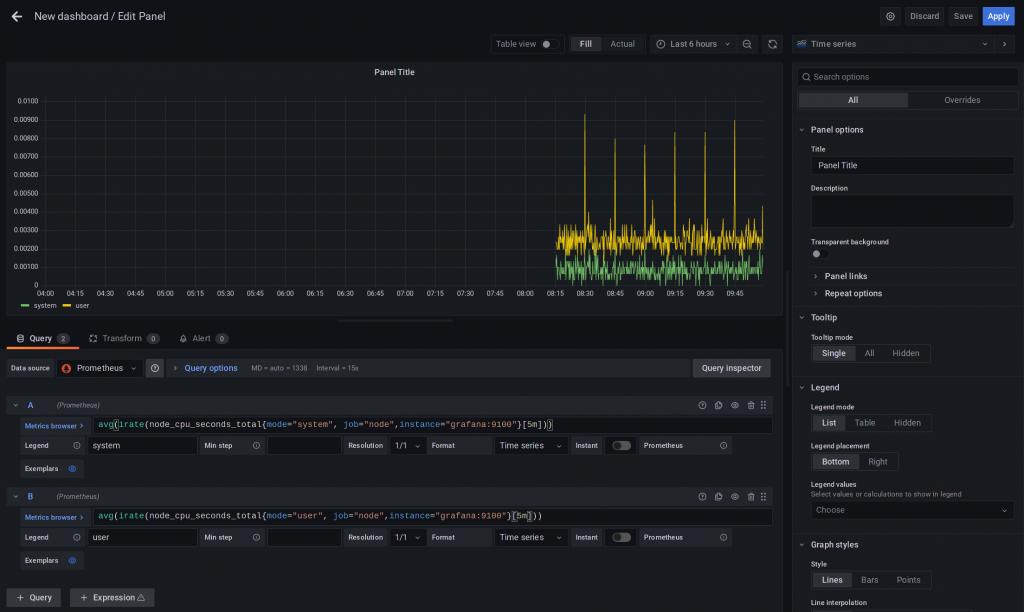
Don’t forget to save and click Apply.
What has been done here?
I started to type node_ which provides me with a list of all node_* metrics and chose node_cpu_seconds_total.
Then the labels are added, within {}.
If you know that you want mode, just start typing it (you may also use the explorer (left side) first or just look through the the exporter output on host:9100 (respective port if you use another one).
Also we want it for the resources defined in job=node and an specific instance.
Then, the function irate is applied.
As stated, prometheus brings some very good functions to deal with timeseries data, but there are so many of them, best read about it here.
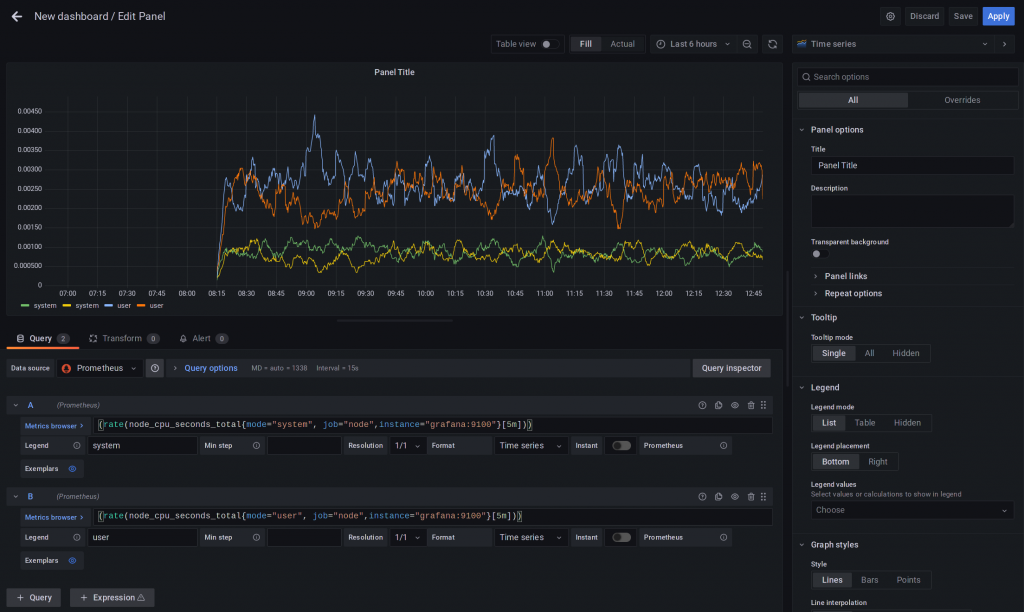
Rate and IRate though are used often (at least by me) and easily confused.
They are pretty similar, but work differently.
As a rule of thumb: irate reacts better to data changes while rate gives more of a trend (see link above on how they really work).
Both get us an “average” (calculated differently) per second rate of events.
For short term CPU Load, I’ll use irate [5m].
(See the picture below for the difference, when using rate)
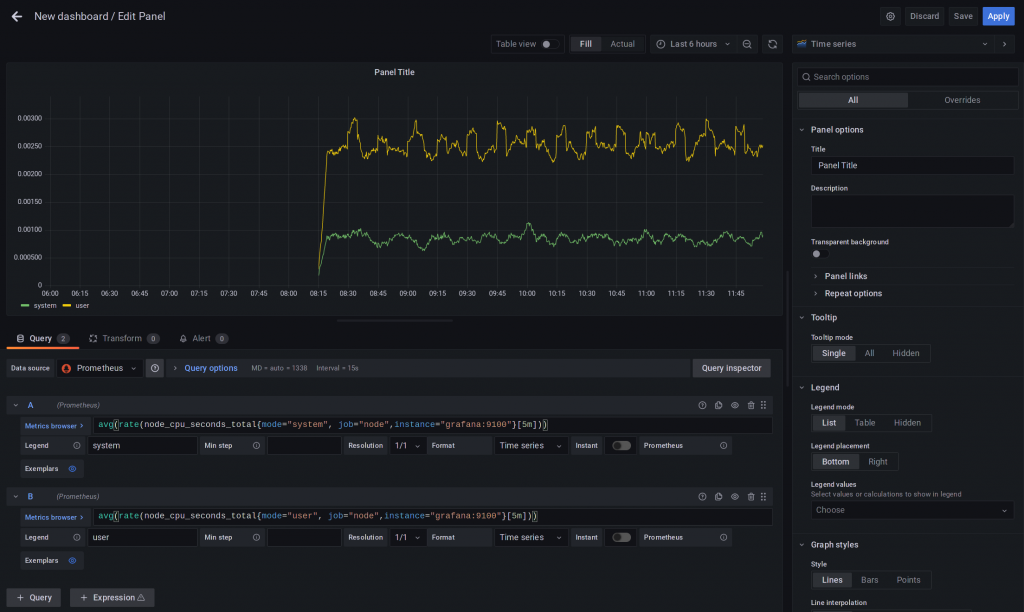
At least (outside) I used the avg aggregator function, to calculate an average over the cpu cores (there are two of them.
Read about aggregator functions here.
Check out how it looks like without avg.
Of course there’s much more to Grafana.
For example: if you click on the “Preferences” Icon in the upper right of the new Dashboard, it is possible to define variables, which (e.g.) can replace mode, job and instance values, helping you to create dynamic and easy to navigate dashboards with drop down fields.
Also worth noticing is, that you don’t need to build every single dashboard yourself.
There are many well maintained and production ready dashboards on grafana.com/dashboards.
Alertmanager
The Alertmanager is prometheus’ “Alert Router”.
It takes alerts, generated from Prometheus’ Alerting Rules through it’s API and converts them into notifications in all kinds of forms: Slack Messages, Emails, and so on.
In a production environment one would set up more than the one we are building for the sake of this article.
Alertmanager can be clustered and replicates it’s state throughout it’s nodes and also de-duplicates alerts.
How does it work?
In short:
Whenever an alert rule fires, prometheus sends and event to the alertmanager API (json) and it keeps doing this as long as the rule matches.
The alertmanager then dispatches these alerts into alert groups (defined by several labels, as everything in prometheus, e.g. alertname), here grouping and de-duplication is done to avoid unnecessary alert spamming, also alerts may be categorized.
From here, each group will trigger the notification pipeline.
First is the Inhibition Phase.
This basically allows for dependencies between alerts to mapped (think of: a switch fails and every rule for connected devices would start alerting, this won’t happen if configured correctly).
Mapping is done in the alertmanager.yaml and thus requires reloading.
Second is the Silencer Phase.
It does what it’s name says, it silences Alarms, either by directly matching labels or by a regex (be careful with that, though).
Silences can be configured through the web interface, by clicking on Silences (http://alertmanager.your.domain:9093/#/silences).
If the alert was not handled by one of the previous phases, it get’s routed.
Basically the alert is send to an endpoint, which has to be configured in alertmanager.yaml, route section.
Several enpoints are pre-configured with example configs.
The configuration:
On prometheus.your.domain, add the Alertmanager section:
# Alertmanager configuration
alerting:
  alertmanagers:
  - static_configs:
      - targets:
          - 'alertmanager.your.domain:9093'
Also, tell prometheus which rule files to evaluate:
# Load rules once and periodically evaluate them according to the global 'evaluation_interval'.
rule_files:
  - "alerting_rules.yml"
Create an alerting rule in alerting_rules.yaml.
This one is pretty straight forward.
Raise an Alert “NodeExporterDown” if “up” for our Job=node is not “1”, for one minute and label it as critical.
Also annotations such as links and other useful stuff may be defined.
groups:
- name: alerting_rules
  rules:

  - alert: NodeExporterDown
    expr: up{job="node"} != 1
    for: 1m
    labels:
      severity: "critical"
    annotations:
      description: "Node exporter {{ .Labels.instance }} is down."
      link: "https://example.com"
Now we need to configure the alertmanager itself.
On alertmanager.your.domain edit /etc/prometheus/alertmanager.yml.
As stated, there are several pre-configured endpoints, let’s just use email.
global:
  smtp_smarthost: 'smtp.whatever.domain:25'
  smtp_from: 'alertmanager@your.domain'
  smtp_auth_username: 'user'
  smtp_auth_password: 'pass'
  smtp_require_tls: true
define a route:
route:
  receiver: operations
  group_by: ['alertname', 'job']
  group_wait: 10s
  group_interval: 10s
  repeat_interval: 3m
define the receiver:
- name: 'operations'
email_configs:
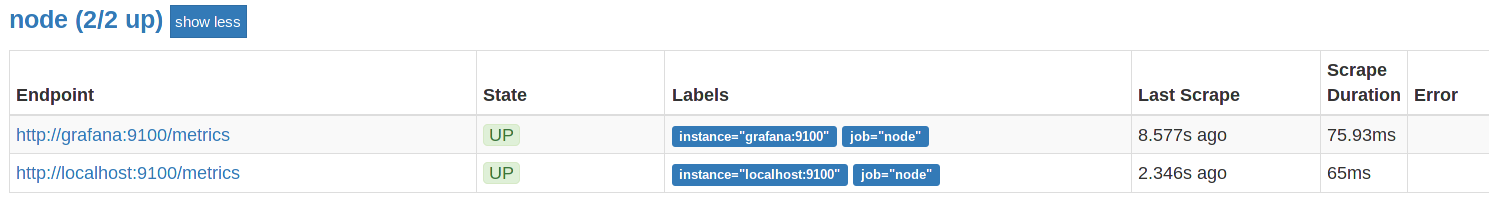
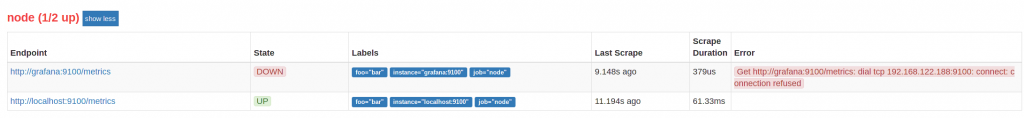
- to: 'your@ops-email.de'So, now, if we stop the prometheus-node-exporter on grafana.your.domain, the rule get’s evaluated and prometheus enters a pending state for one minute to see if the service comes up again.
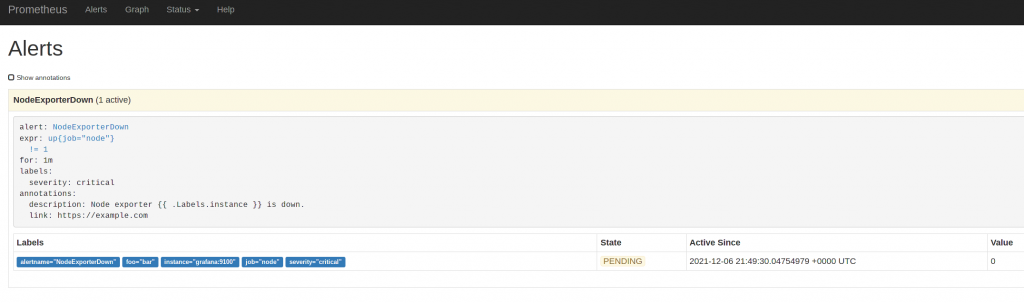
If it does not, the service is marked as down:
and the prometheus alert starts firing:
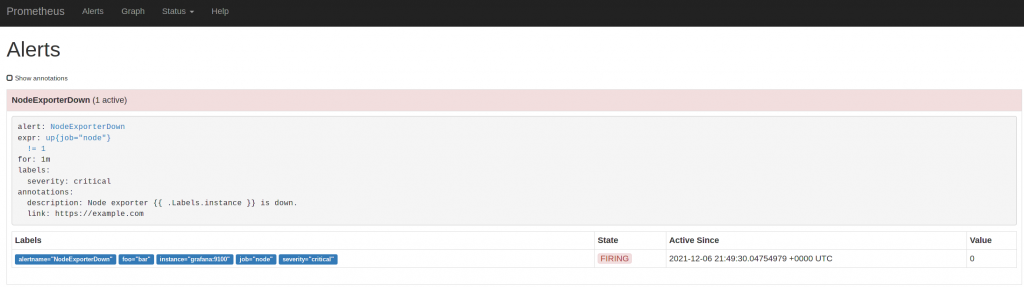
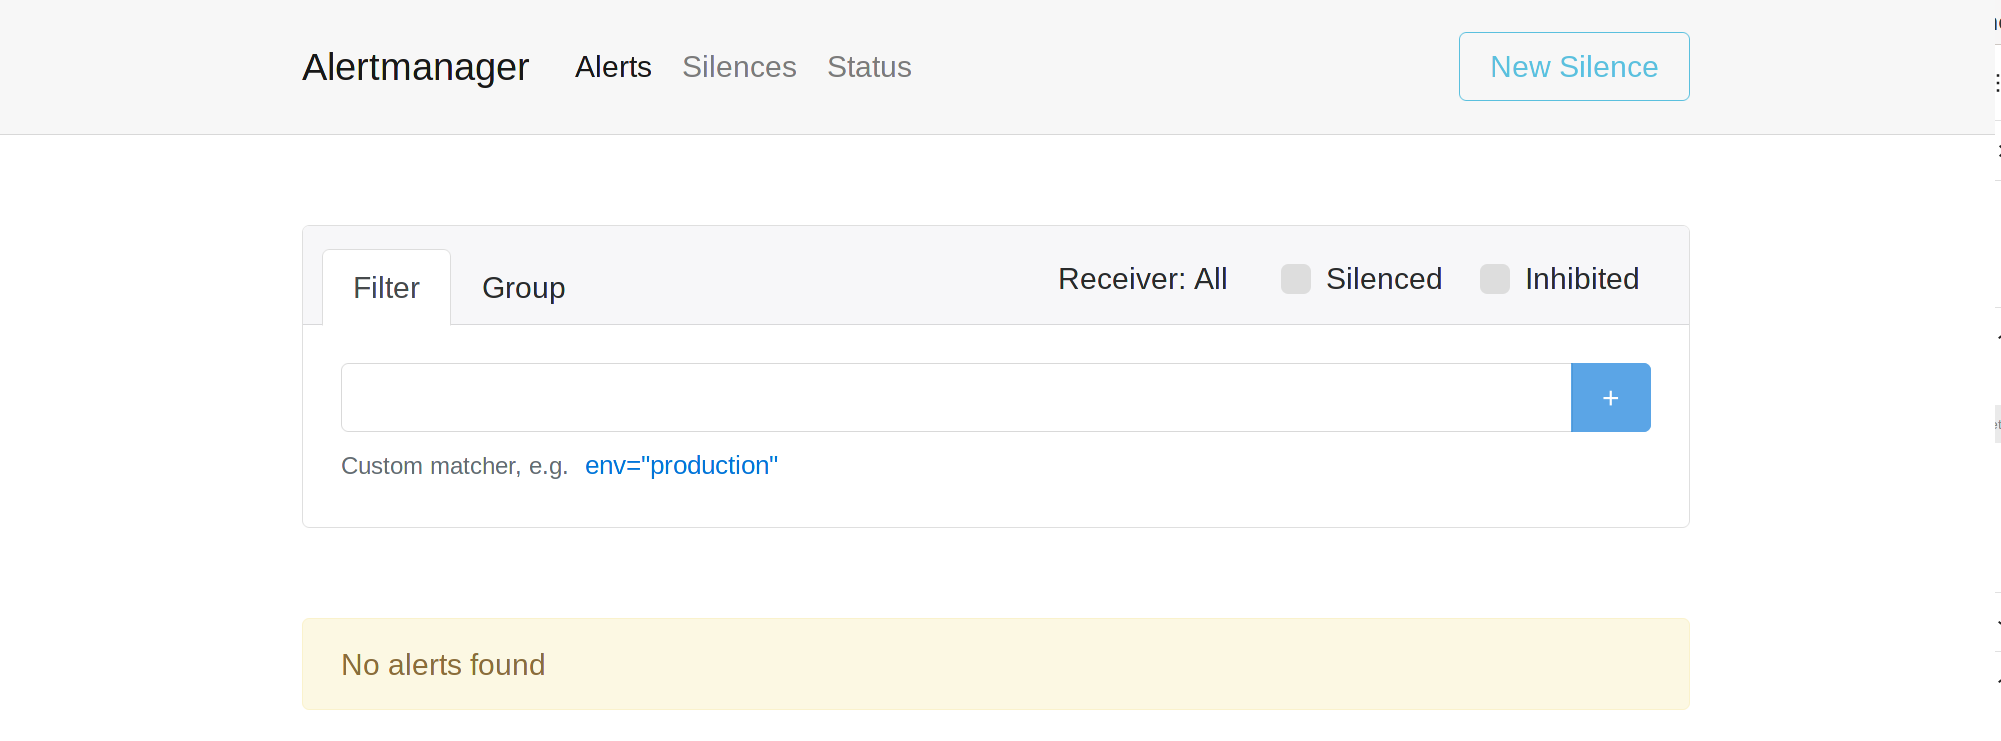
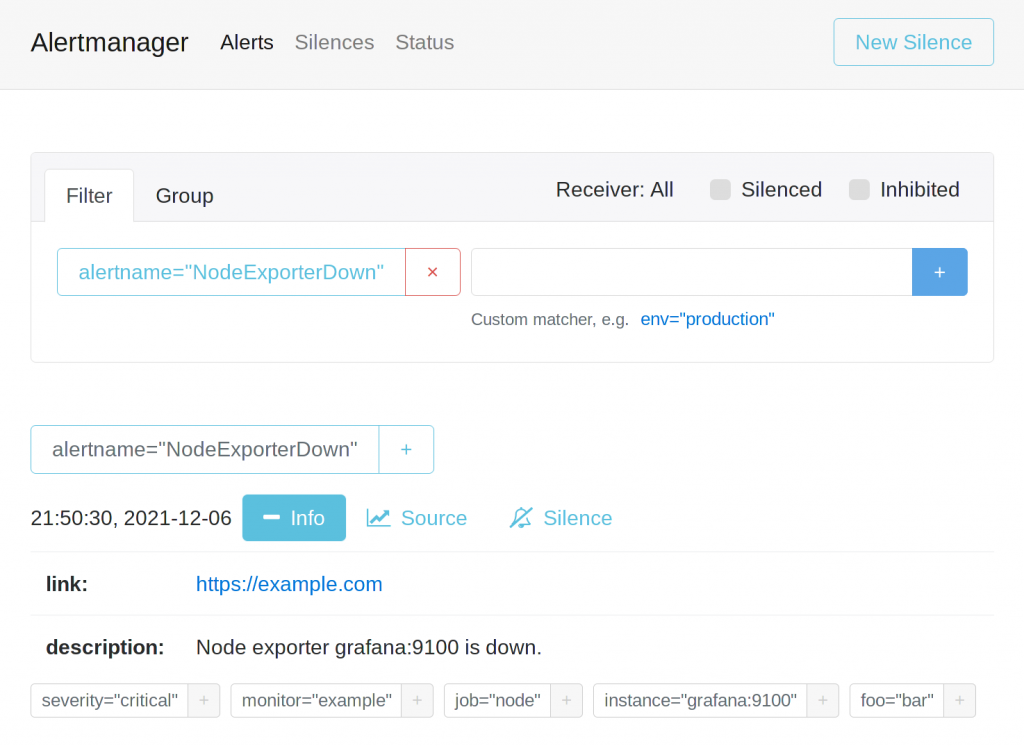
We can check for it on the alertmanager.your.domain web interface:
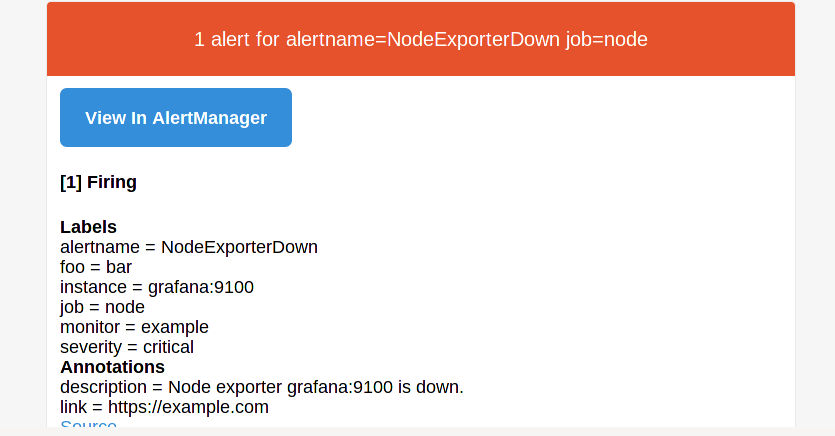
and also get an email:
That’s it. Prometheus, some basic rules, Grafana and a basic dashboard, and also Alertmanager and a basic alarming is up and running.
Of course there is much more to know, especially about alerting and recording rules, promql and dynamic configuration, as well as cloud configs and operators, long term storage and so on.
I’d recommend reading the excellent Infrastructure Monitoring with Prometheus as well as the official documentation on the prometheus website.